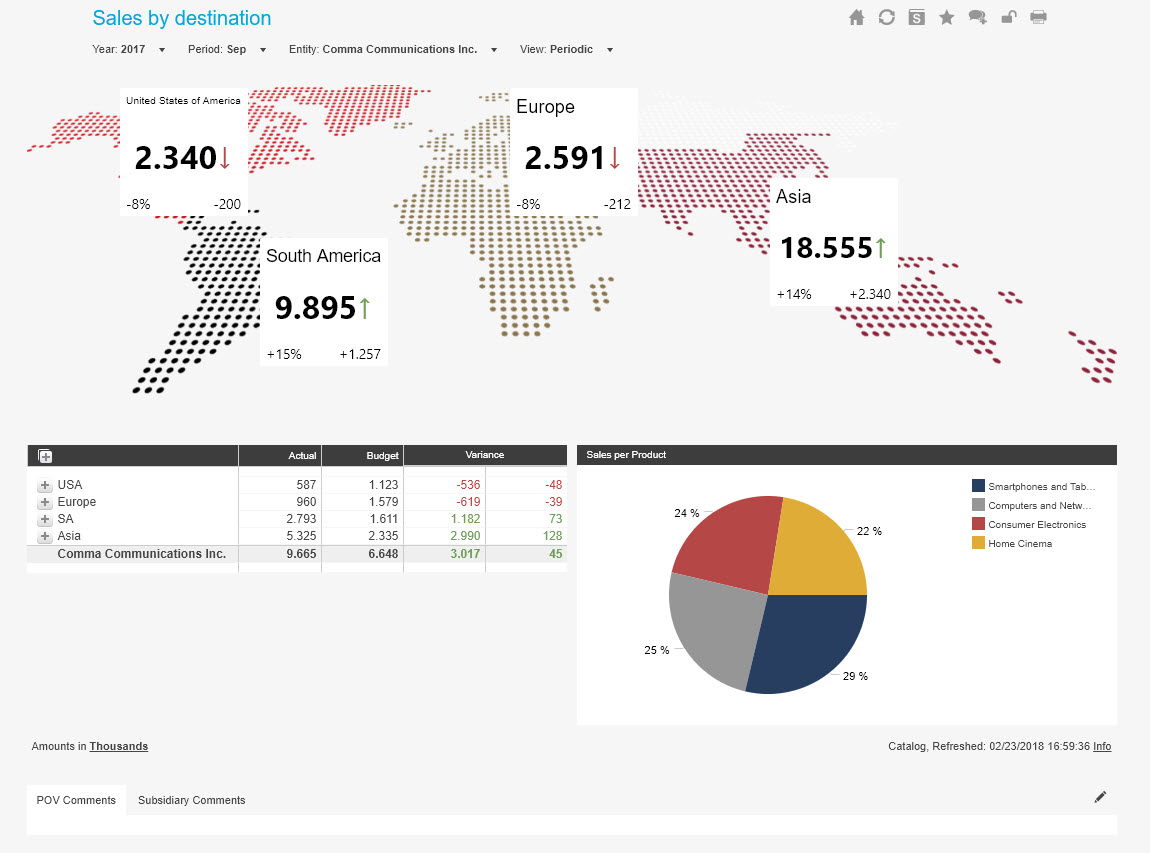
Sales performance by location
Display your regional sales on a map.
During our Agora 2018 event this dashboard/report was shared by our client Symrise and was received with great enthusiasm by many other clients. We therefore make this report now available for your organization.
Starting with your regional sales numbers displayed on a map, the dashboard/report provides organizations with the opportunity to analyze sales numbers by drilling down by location/regions and by drilling into products sold too (or any other detail) all visible in a pie chart.
Click on the add button to start the wizard and easily add this dashboard/report to your existing application. One of the options you have is to select the type of detail you would like to use in the pie chart.
Recommendations:
After adding the report to your application, it is possible to change the image of the map. You can also make the pie chart drillable by selecting the option ‘Allow POV Change’ and add the dimension of your pie chart to the POV. You can make the report even more dynamic by adding reference scenarios in the POV.
Requirements:
– Variable: @CAT_Actual
– Variable: @CAT_Budget
CXO Software License Is Required
Existing CXO Software Customers:
Login or register to access this dashboard.
Not using CXO Software Yet?
Financial and performance dashboards that provide actionable insights from Enterprise Performance Management data and systems like Oracle Hyperion, OneStream, Tagetik, SAP, MS, SSAS and more.
Reviews
Written by Mark van Leeuwen on 29/11/2018
Written by Jake Massincaud on 29/11/2018
Your review of Sales performance by destination
HQ Europe Herculesplein 48, 3584 AA Utrecht, The Netherlands: (+31) 85 043 2265