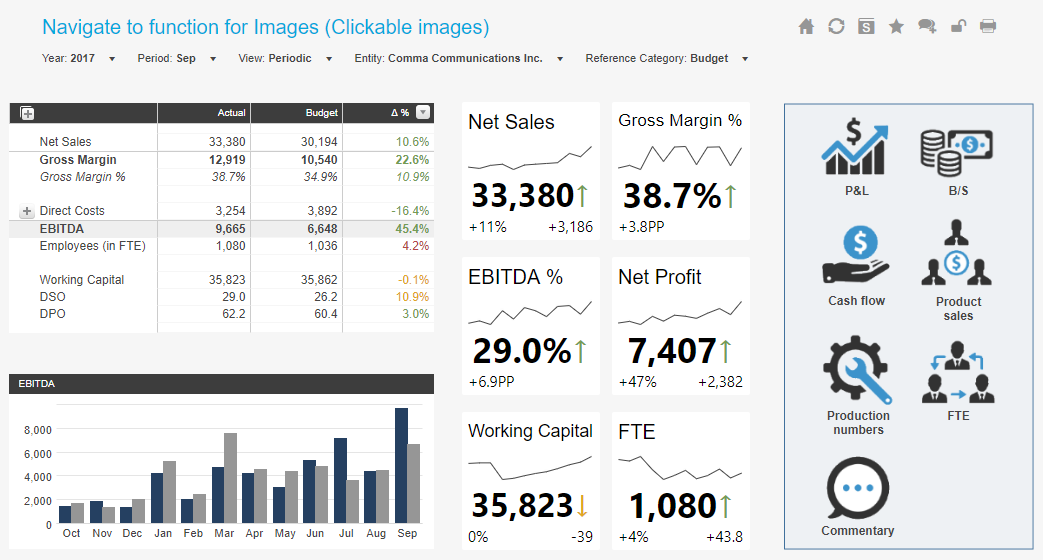
Home page with image redirects
Display your P&L and navigate to key reports.
Starting with your profit and loss statement and key figures intuitively displayed in the six tiles (after importing the report you can add more tiles if required). The report provides organizations the opportunity to navigate instantly from the tile or image to a more detailed report using the re-direct function.
Table:
Displays the profit and loss with a variance reference to the selected point of view. Variances are displayed as absolute, percentage or trend arrow.
Bar chart:
The bar chart shows the selected account in the profit and loss in a graphical display over a predefined time series.
Tiles:
Each tile gives you all the important information, such as variance versus reference scenario and a micro-chart to spot trends instantly.
Images:
The images will redirect you to a more detailed report of the corresponding topic.
Recommendations:
After adding the report to your application, it is recommended to change the POV description for the scenario dimension to ‘Reference scenario’.
Requirements:
– Variable: @CAT_Actual
CXO Software License Is Required
Existing CXO Software Customers:
Login or register to access this dashboard.
Not using CXO Software Yet?
Financial and performance dashboards that provide actionable insights from Enterprise Performance Management data and systems like Oracle Hyperion, OneStream, Tagetik, SAP, MS, SSAS and more.
Reviews
Be the first to review
Your review of Home page with image redirects
HQ Europe Herculesplein 48, 3584 AA Utrecht, The Netherlands: (+31) 85 043 2265