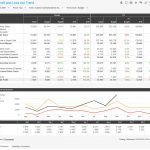
Profit and Loss incl predictive analysis
Use an algorithm to help predict your future performance
This dashboard will provide the user with a prediction of future performance based on 2 full historical years. The prediction is made for the remainder of the current year and the next year. The power of this visualization is that you can compare budget to the prediction based on the historical trend.
This chart also uses the smart variance colouring (new CXO Software chart functionality!) where green means that you performed better than your budget and red shows that budget wasn’t met. The confidence interval determines the upper and lower confidence bounds of the prediction. The clearer a seasonal trend is, the thinner this area will be.
Requirements:
– Variable: @CAT_Actual
– Variable: @CAT_Budget
– Variable: @CAT_Forecast
– Enabled prediction functionality, together with at least 25 months of history
CXO Software License Is Required
Existing CXO Software Customers:
Login or register to access this dashboard.
Not using CXO Software Yet?
Financial and performance dashboards that provide actionable insights from Enterprise Performance Management data and systems like Oracle Hyperion, OneStream, Tagetik, SAP, MS, SSAS and more.
Reviews
Be the first to review
Your review of Profit and Loss incl predictive analysis
HQ Europe Herculesplein 48, 3584 AA Utrecht, The Netherlands: (+31) 85 043 2265