Company overview
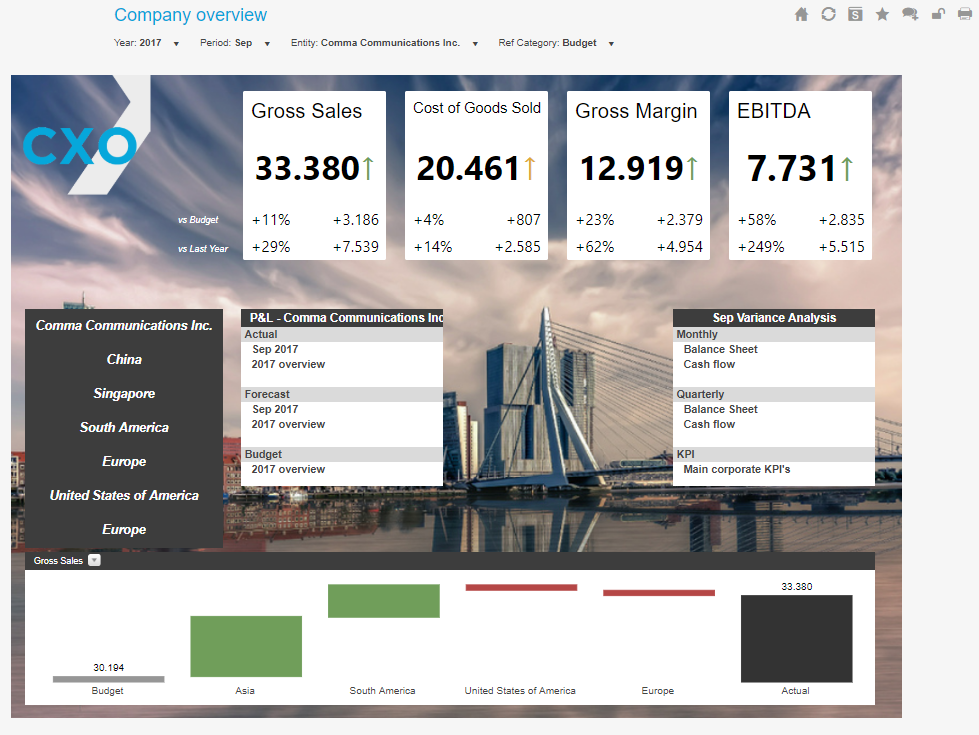
Display your key figures and navigate to key reports.
Starting with your key numbers intuitively displayed in the four tiles (after importing the report you can add more tiles if required). Variances versus Budget and Last Year are both shown in the tiles. The report provides organizations the opportunity to link from the three tables to meaningful reports.
1st table:
Gives the opportunity to use a dimension (Entity, Product e.g.) to link to a specific report or homepage for the selected member.
2nd and 3rd table:
Can be a selection of reports to navigate to. These tables provide the user to open reports based on different categories, view and periods (month vs quarter).
At the bottom a bridge is shown based on an account of one of the four tiles which can be selected in the selector. The bridges is showing the movements based on the children of the selected entity in the POV.
Recommendations:
After adding the report to your application, it is recommended to change the images of the background and logo (to make the report entity/company specific). You can make the report even more dynamic by adding reference scenarios in the POV.
Requirements:
– Variable: @CAT_Actual
– Variable: @CAT_Budget
CXO Software License Is Required
Existing CXO Software Customers:
Login or register to access this dashboard.
Not using CXO Software Yet?
Financial and performance dashboards that provide actionable insights from Enterprise Performance Management data and systems like Oracle Hyperion, OneStream, Tagetik, SAP, MS, SSAS and more.
Reviews
Be the first to review
Your review of Company overview
HQ Europe Herculesplein 48, 3584 AA Utrecht, The Netherlands: (+31) 85 043 2265