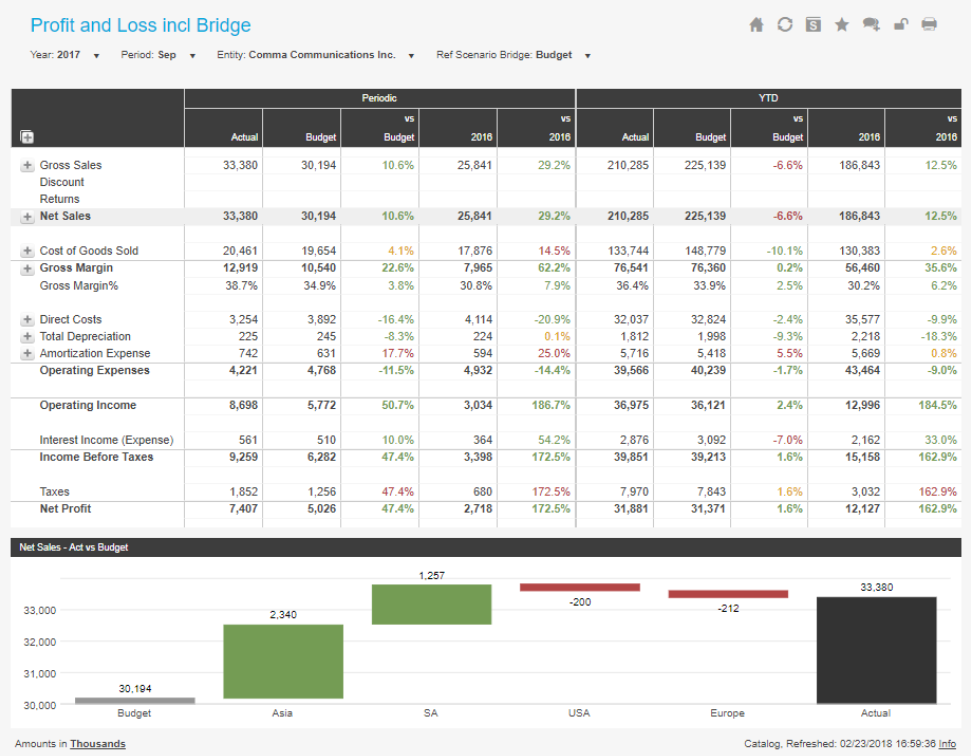
Profit and Loss including bridge chart
Kick excel to the curb and utilize the ‘Profit and loss including bridge’ template to give you better insight and a deeper understanding of your organizations performance!
This template presents traditional multi-column data while layering all the power and performance of CXO’s visualization techniques and dynamic drill down functionality. This financial statement takes your P&L and truly provides the flexibility and depth your organization demands. The selected account in the row list will show a breakdown at the bottom of the report via the bridge control.
The wizard will guide you through assignment of your P&L list and the comparative components to quickly create the report in a way that makes sense to your organization.
Recommendations:
Change the POV dimension name into ‘Ref Scenario’ to use this dimension to compare the actual scenario with the selection made in the POV. Use a list for the POV with the only applicable scenarios.
A further recommendation is to enable ‘insert data label’ of movements in the bridge chart and you can use a dynamic description by using [dim] (e.g. [ACC])
Requirements:
“VariableName”: “@CAT_Actual”
“VariableName”: “@VIW_Periodic”
“VariableName”: “@VIW_YTD”
CXO Software License Is Required
Existing CXO Software Customers:
Login or register to access this dashboard.
Not using CXO Software Yet?
Financial and performance dashboards that provide actionable insights from Enterprise Performance Management data and systems like Oracle Hyperion, OneStream, Tagetik, SAP, MS, SSAS and more.
Reviews
Be the first to review
Your review of Profit and Loss including bridge chart
HQ Europe Herculesplein 48, 3584 AA Utrecht, The Netherlands: (+31) 85 043 2265