Dashboard – 13 Months Rolling (for splitted dimension)
Centralize your long-term reporting trend review with the 13 Months Rolling Dashboard.
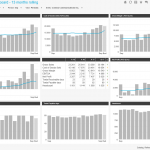
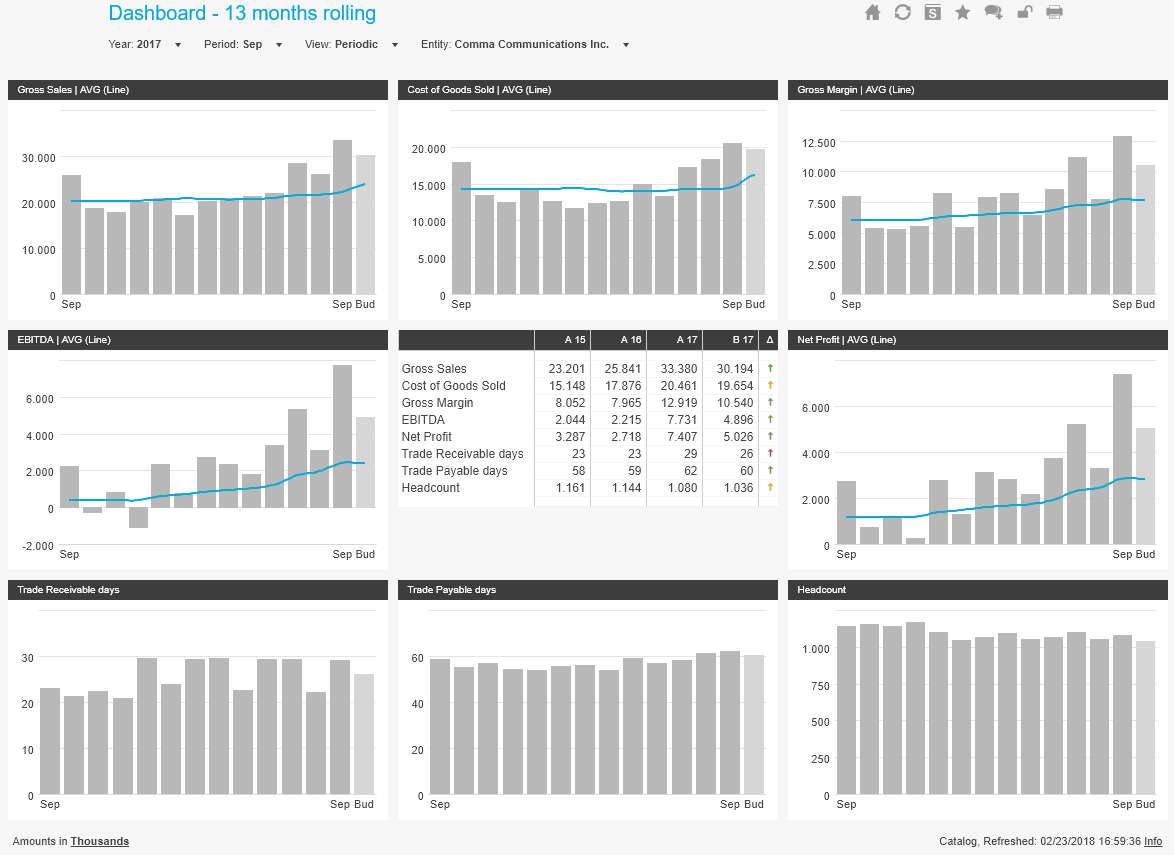
Centered around a customized table, the ‘13 months rolling dashboard’ provides 8 bar and line charts to show a comparative trend of strategic data points, helping organizations achieve operational efficiencies by understanding their actual performance trend against their target.
The wizard will intuitively guide you through the process of selecting the accounts and various methods of trend review then present your information in a compelling way that efficiently guides your strategic analysis.
Requirements:
– Your Period dimensions should be split into a Period and View dimension
– Variable: @CAT_Actual
– Variable: @CAT_Budget
– Variable: @VIW_Periodic
CXO Software License Is Required
Existing CXO Software Customers:
Login or register to access this dashboard.
Not using CXO Software Yet?
Financial and performance dashboards that provide actionable insights from Enterprise Performance Management data and systems like Oracle Hyperion, OneStream, Tagetik, SAP, MS, SSAS and more.
Reviews
Be the first to review
Your review of Dashboard - 13 months rolling (for splitted dimension)
HQ Europe Herculesplein 48, 3584 AA Utrecht, The Netherlands: (+31) 85 043 2265